Course Analytics
Every course has its own analytics. Open the course in the dashboard and go to the Analytics tab. You see how learners find, enroll in, move through and finish that one course.
Course analytics needs the Pro plan or higher on LearnHouse Cloud. On self-hosted instances it is available in every edition once analytics is set up. The API only returns course analytics to organization admins.
Widgets
A 7d / 30d / 90d picker at the top sets the time range (30 days by default). The top row shows Views, Enrollments, Completions and Completion Rate for the course.
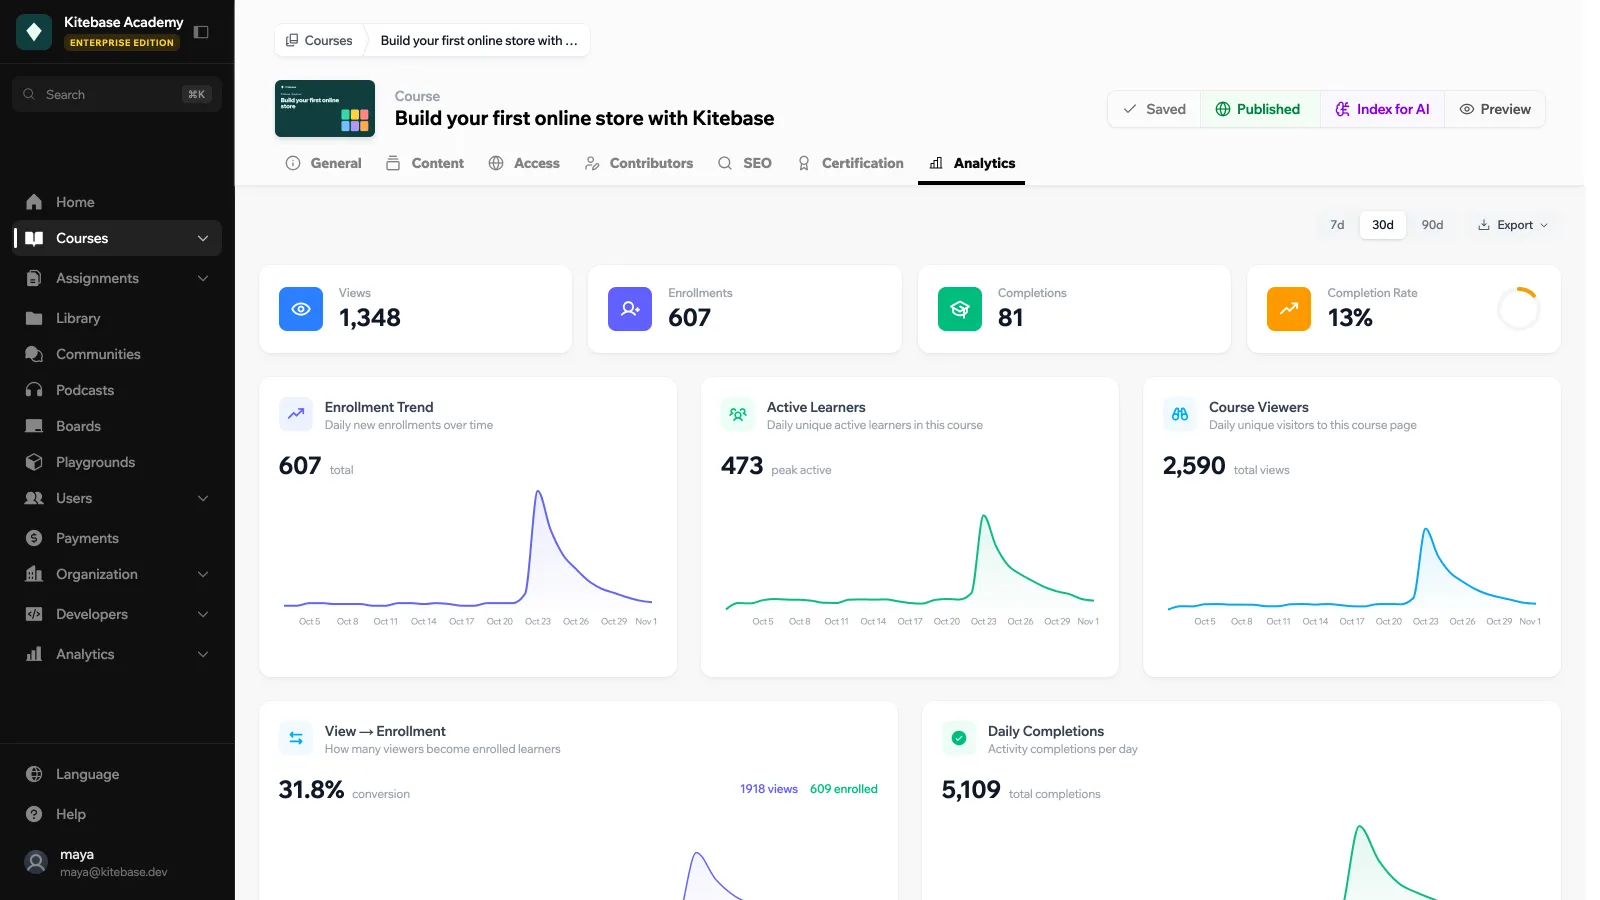
| Widget | Description |
|---|---|
| Enrollment Trend | Daily new enrollments over time |
| Active Learners | Daily unique active learners in this course |
| Course Viewers | Daily unique visitors to this course page |
| View → Enrollment | How many viewers become enrolled learners |
| Daily Completions | Activity completions per day |
| Activity Completion Funnel | Views vs completions per activity |
| Time Spent per Activity | Average time learners spend on each activity |
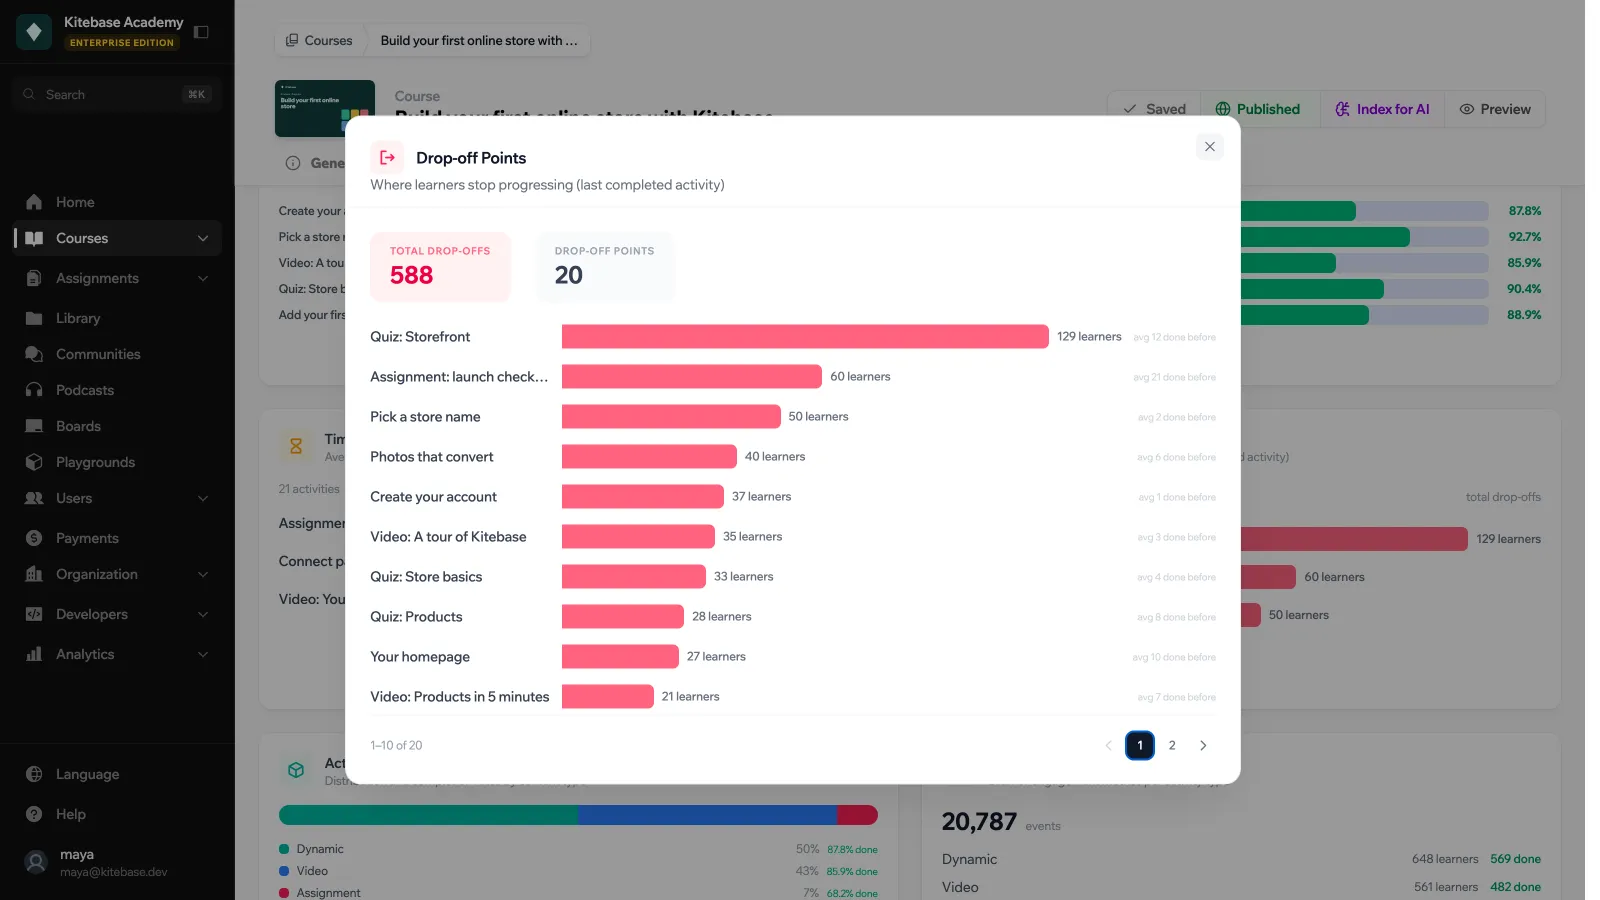
| Drop-off Points | Where learners stop progressing (last completed activity) |
| Activity Type Breakdown | Distribution and completion rates by content type |
| Engagement by Content Type | Learner engagement metrics per activity type |
| Completion Velocity | How quickly learners progress from one activity to the next. Lower is better. |
| Time to Completion | How long it takes learners to finish this course |
| Certification Rate | % of completers who claimed their certificate |
| Daily Time per Learner | Average time each learner spends per day |
| Learner Progress | How many activities learners have completed |
| Peak Learning Hours | When learners are most active in this course |
| Learner Retention | % of learners returning after first activity |
| Top Learners | Most active learners by completions |
| Recent Enrollments | Latest learners who enrolled in this course |
Use the expand icon on a widget to open its detail view. For example, Drop-off Points lists each activity with the number of learners for whom it is the last one they finished. Learners who finished the course count on its last activity, so the final lesson usually shows a bar too.
Use Export to download the course data as JSON or CSV.
Who can open the tab
The tab appears for users who can update the course. The data itself comes from admin-only API endpoints, so in practice you need a role that can update the organization (the Admin role by default).
