Assignment Analytics
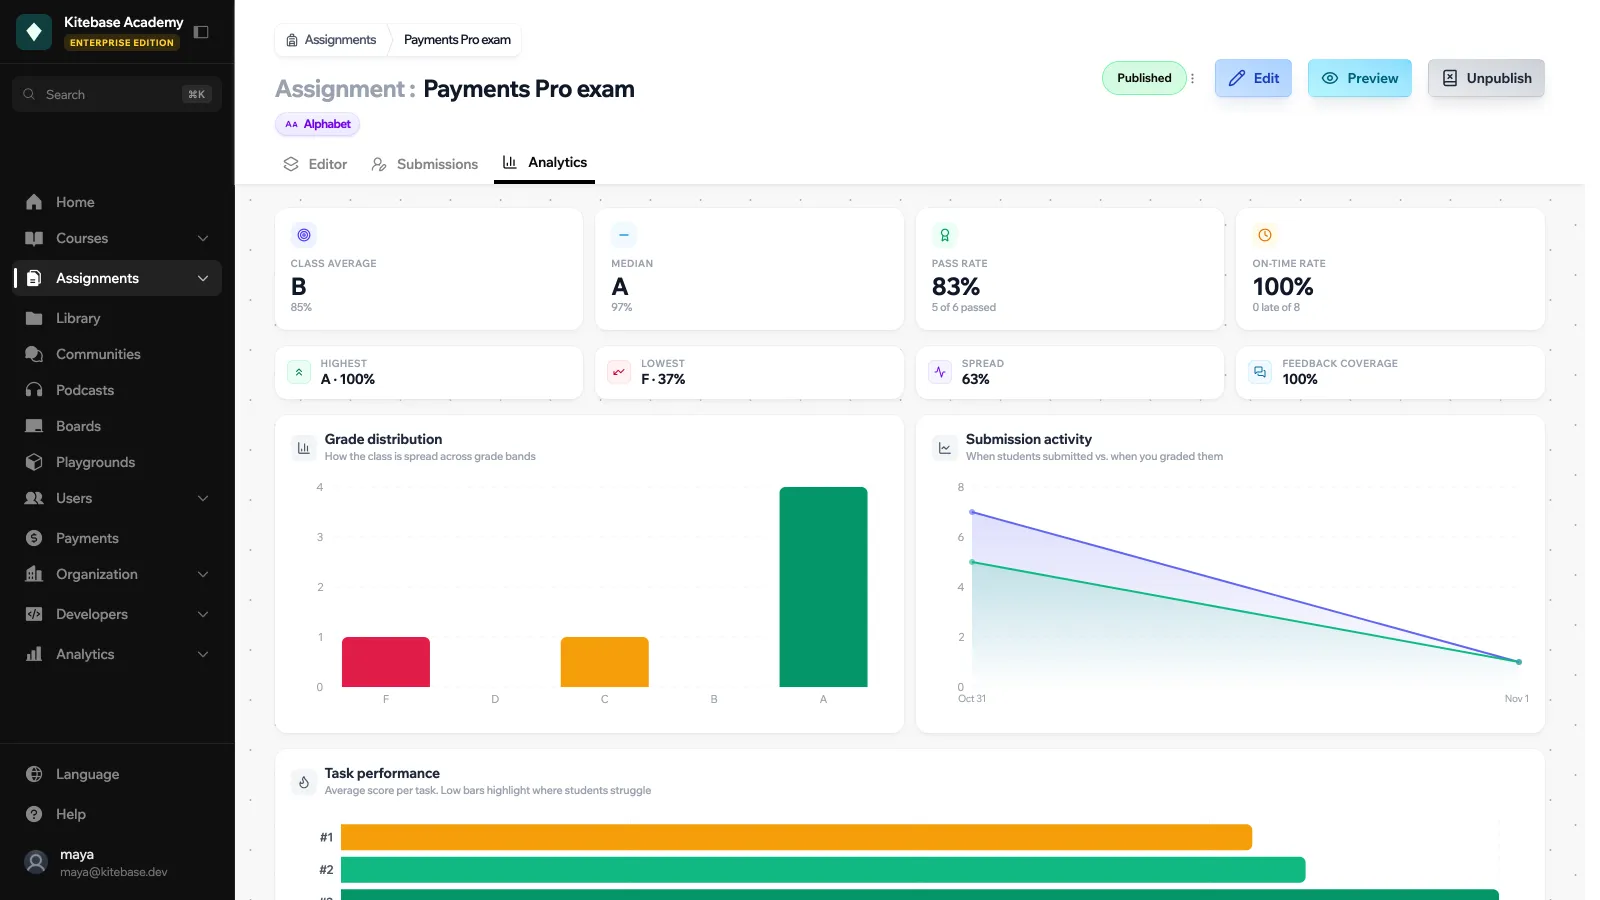
Each assignment has an Analytics tab in the dashboard, next to Editor and Submissions. It fills in as soon as learners start submitting.
Key figures
| Figure | What it shows |
|---|---|
| Class Average | Average grade across graded submissions. |
| Median | Median grade. |
| Pass Rate | How many learners passed, out of those graded. |
| On-Time Rate | How many submissions came in before the due date. |
| Highest / Lowest / Spread | The best and worst grade and the gap between them. |
| Feedback coverage | How many graded submissions have written feedback. |
Charts and lists
- Grade distribution: how the class is spread across grade bands.
- Submission activity: when learners submitted against when you graded them, with the due date marked.
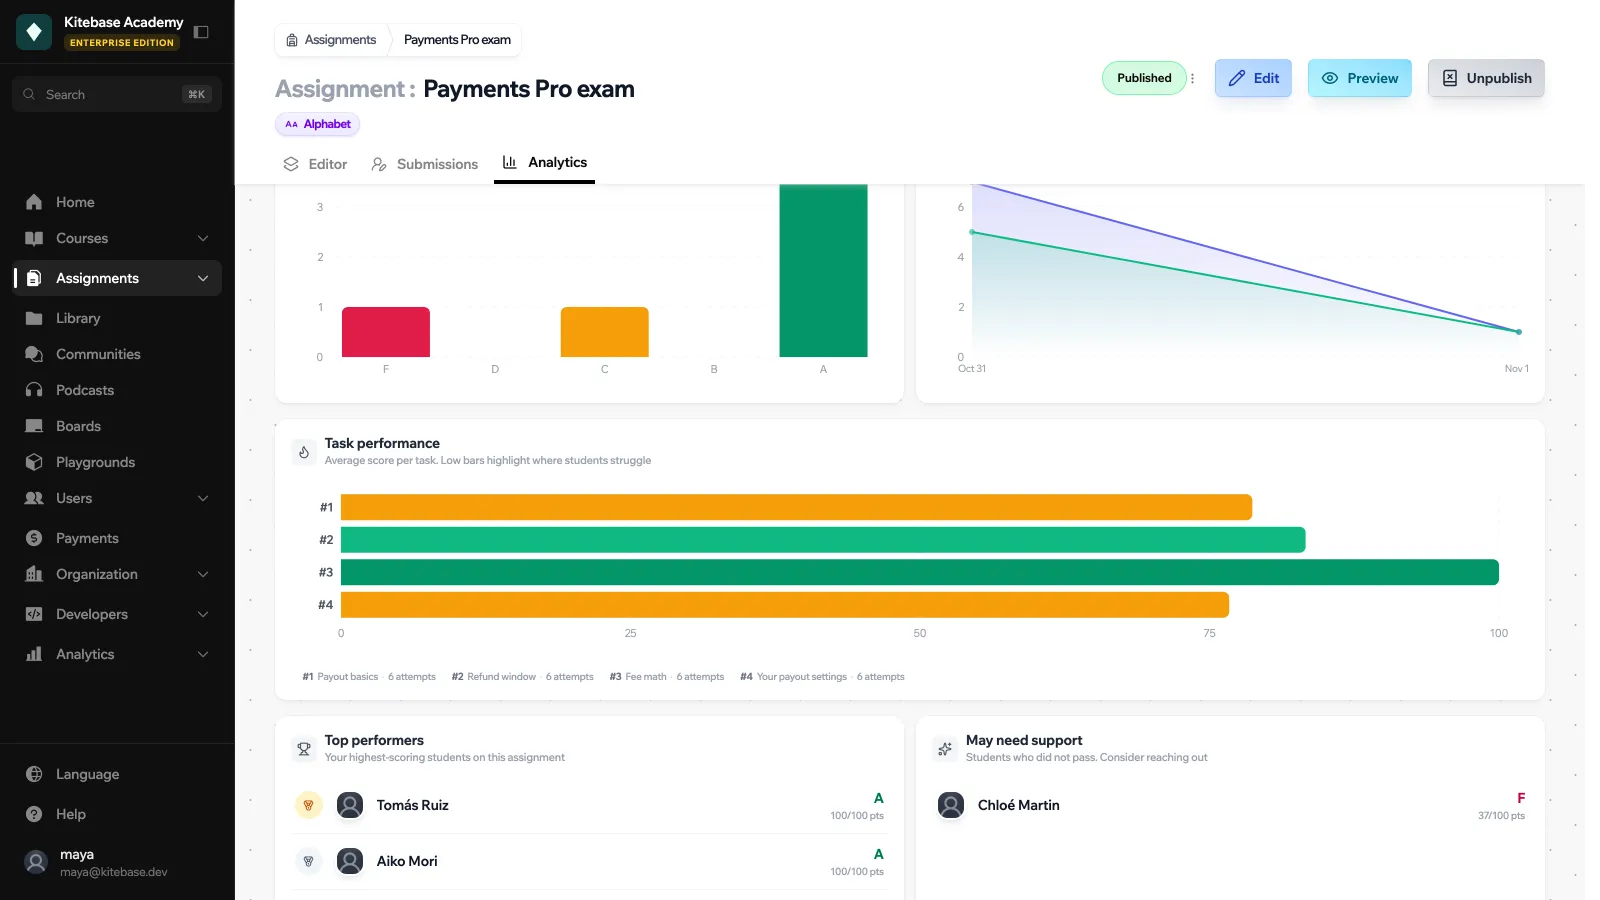
- Task performance: average score per task. Low bars show where learners struggle.
- Top performers: the highest-scoring learners on this assignment.
- May need support: learners who did not pass, so you can reach out.
For organization-wide analytics, see Analytics.
