Analytics Dashboard
Open Analytics in the dashboard sidebar to see organization-wide numbers. The page has two tabs, Overview and Advanced, and a time range picker with 7d, 30d and 90d (30 days by default). The range applies to every widget that uses one.
The dashboard needs analytics to be set up and an eligible plan. See Analytics for availability and setup.
Overview
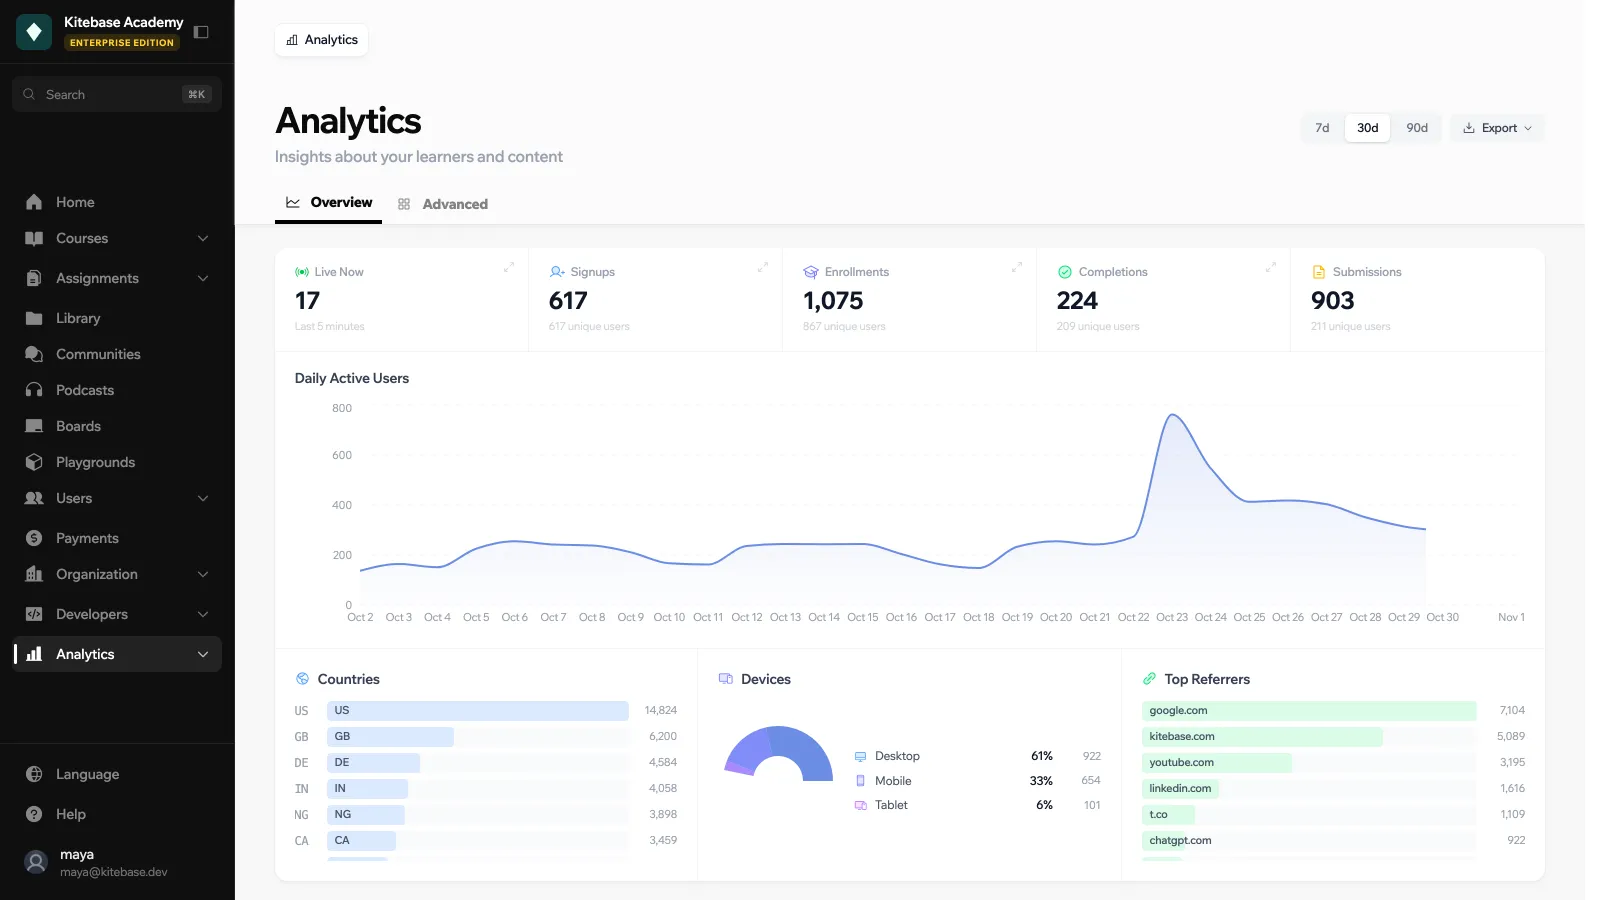
Headline numbers
| Widget | What it shows |
|---|---|
| Live Now | Users active in the last 5 minutes. Click it to see each user’s current page, device, country and last seen time. |
| Signups | New registrations in the selected range. Click it for the list with email and signup method. |
| Enrollments | Course enrollments in the range. |
| Completions | Course completions in the range. |
| Submissions | Assignment submissions in the range. |
| Daily Active Users | Unique users per day. |
| Countries / Top Countries | Where visitors come from. Needs a proxy that sets a country header, such as Cloudflare. |
| Devices | Split between Desktop, Mobile and Tablet. |
| Top Referrers | The sites that send you traffic. |
Core widgets
| Widget | What it shows |
|---|---|
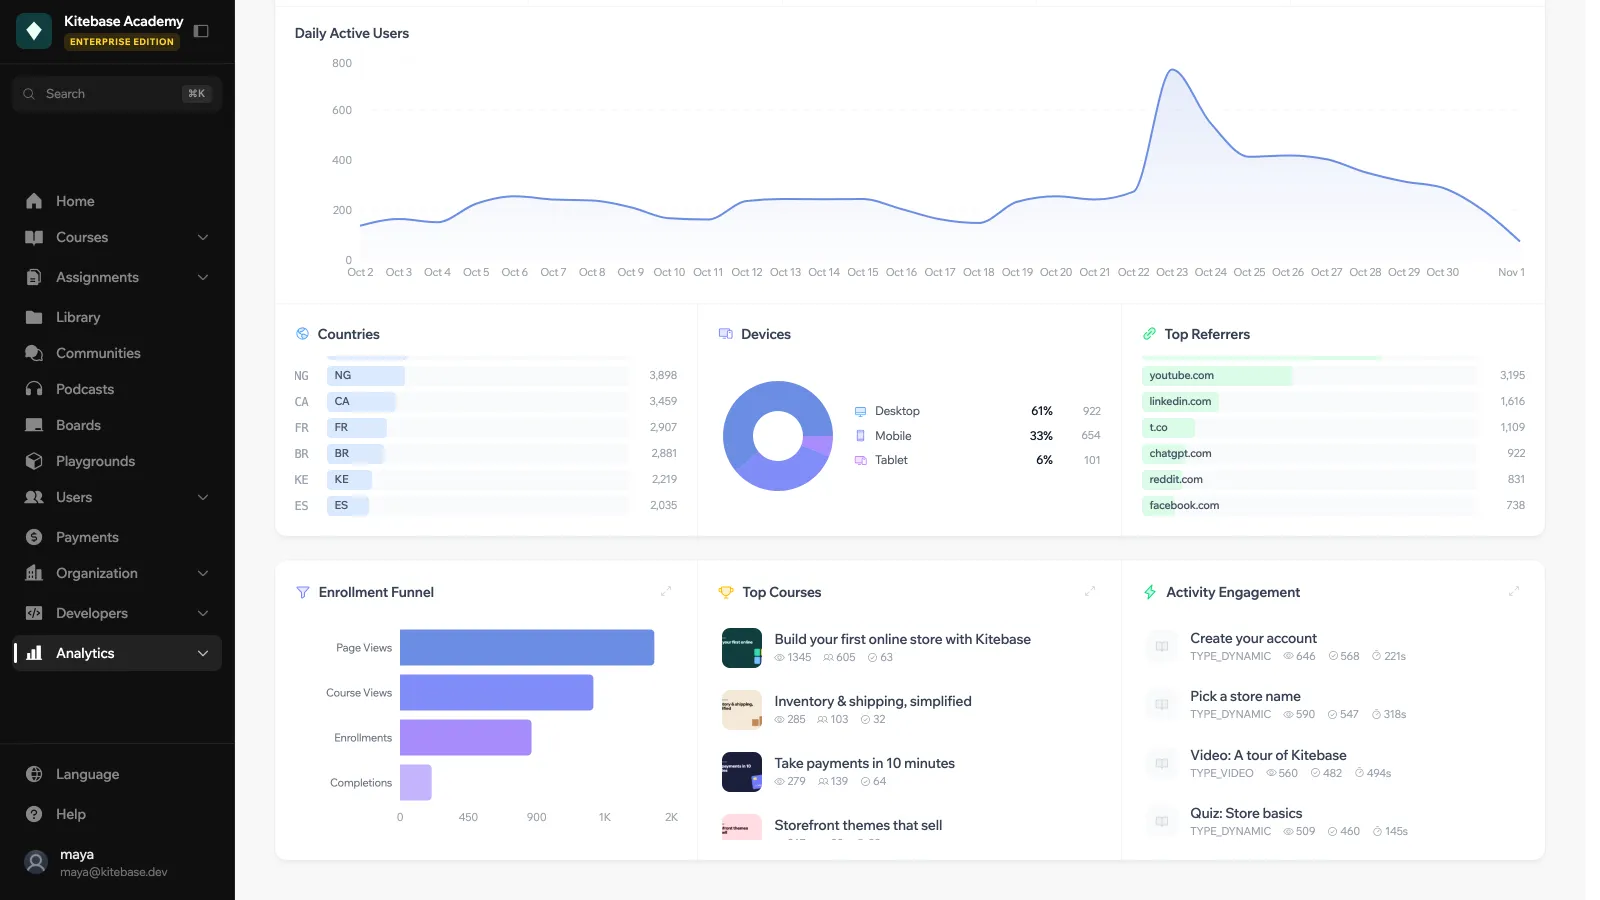
| Enrollment Funnel | Page Views, Course Views, Enrollments and Completions, with conversion rates for View → Enroll, Enroll → Complete and Page → Complete. |
| Top Courses | Your most viewed courses, with views, enrollments and completions. |
| Activity Engagement | The lessons learners spend the most time on, with type and average time. |
Advanced
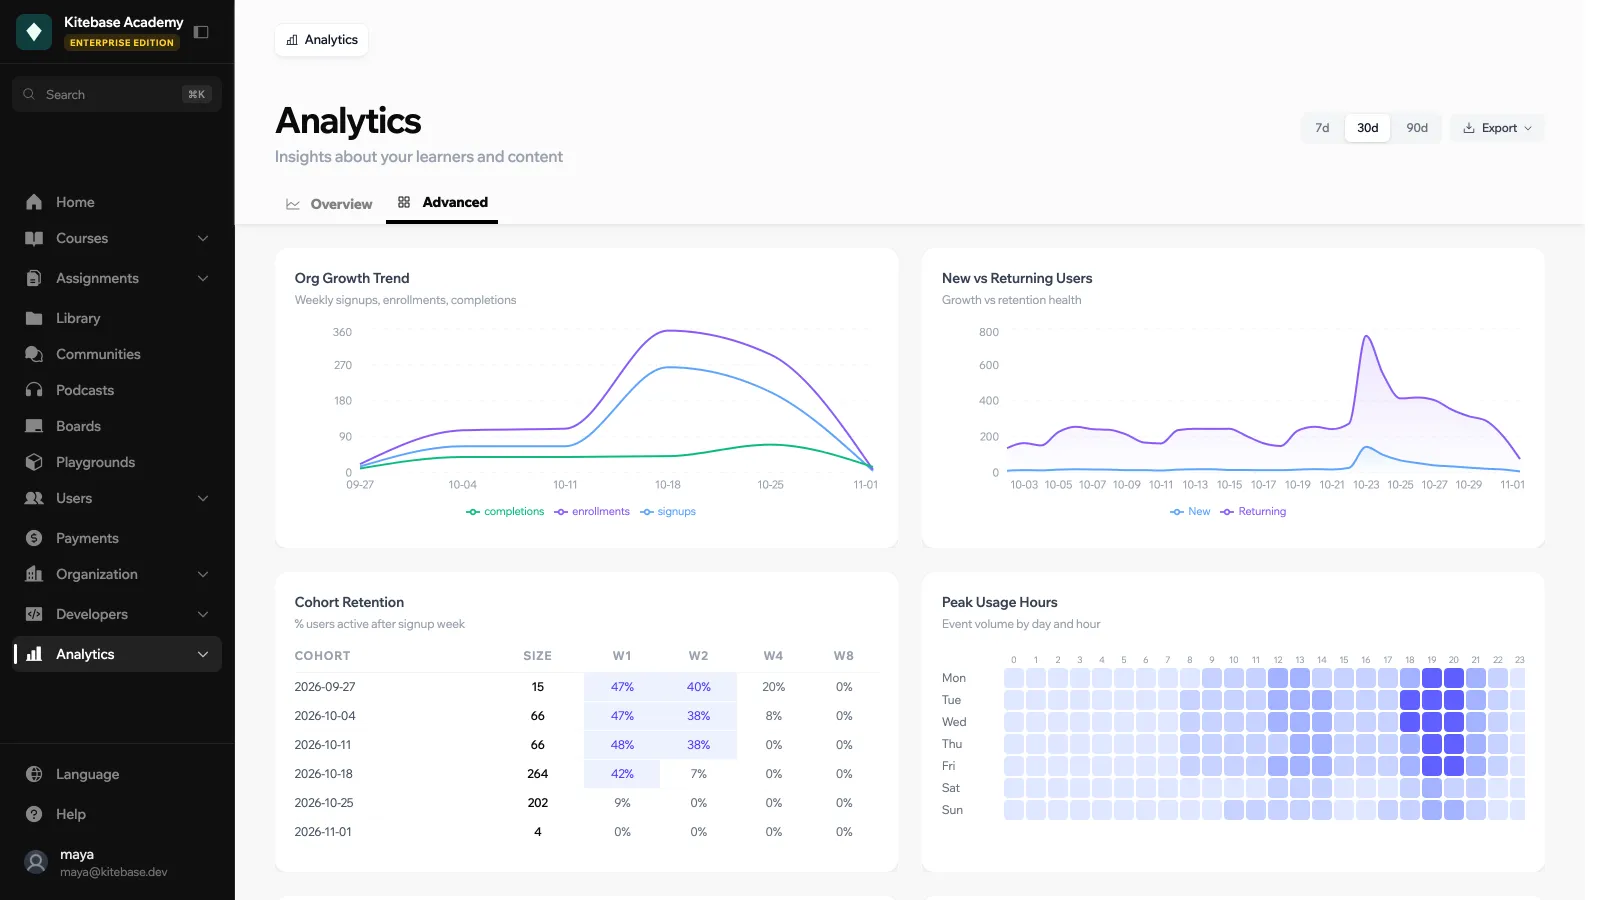
The Advanced tab adds deeper widgets. Each one shows a plan badge and an upgrade link when your organization is not eligible.
| Widget | Description |
|---|---|
| Org Growth Trend | Weekly signups, enrollments, completions |
| New vs Returning Users | Growth vs retention health |
| Cohort Retention | % users active after signup week |
| Peak Usage Hours | Event volume by day and hour |
| Course Dropoff | Where users stop per course |
| Time to Completion | Median days to complete each course |
| Completion Velocity | Avg days between activity completions |
| Content Type Effectiveness | Completion rate by activity type |
| Course Effectiveness Matrix | Activity count vs completion rate (sized by enrollments) |
| Community Correlation | Completion rate: discussors vs non-discussors |
| Learner Engagement Score | Top learners by composite engagement |
| User Progress Snapshot | Users at each completion bracket per course |
| Grade Distribution | Assignment grade histogram |
| Certification Rate | % of completers who claim certificates |
| Search Effectiveness | Top queries and zero-result rate |
Time to Completion always covers the last 180 days, whatever the range picker says.
Exporting
Click Export in the page header and choose Download JSON or Download CSV. The file holds the data behind the tab you are on (Overview or Advanced) for the selected range, and is named like analytics_30d.csv. Exporting needs the same admin rights and plan as viewing the widgets.
Data freshness
Results are cached for up to 1 minute on the overview and 5 minutes on the advanced tab. Live Now is always live.
